What is a cumulative frequency?
The accumulated frequency is the result of successively adding the absolute or relative frequencies, from the lowest to the highest of their values.
Cumulative Frequency: Simple Explanation
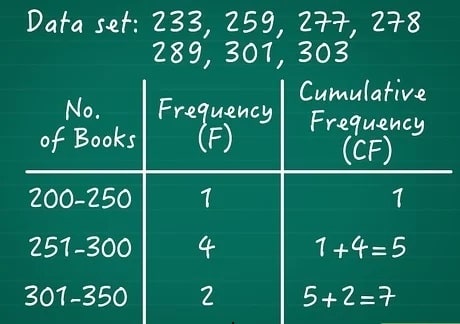
To calculate the cumulative frequency, the data must first be sorted from lowest to highest. Then, they are placed in a table for a clearer view. Once sorted, the cumulative frequency is obtained by adding the frequencies of each group with those of the previous group. In this way, the values are accumulated until the total is reached.
Types of accumulated frequencies
There are two types, absolute and relative:
1. Cumulative absolute frequency
The absolute frequency gives us information about the number of times an event is repeated when performing a certain number of random experiments. To find the accumulated absolute frequency, we would simply accumulate the absolute frequencies. This is called by the letters Fi.
Suppose that the grades of 20 first-year economics students are as follows:
1,2,8,5,8,3,8,5,6,10,5,7,9,4,10,2,7,6,5,10.
First, the data is ordered from smallest to largest, tabulated, and then accumulated.
Therefore we have:
Xi = Statistical random variable, first-year economics exam grade.
N = 20
fi = Number of times the event is repeated (in this case, the exam grade).
| Xi | fi | Fi |
| 1 | 1 | 1 |
| 2 | 2 | 3 |
| 3 | 1 | 4 |
| 4 | 1 | 5 |
| 5 | 4 | 9 |
| 6 | 2 | 11 |
| 7 | 2 | 13 |
| 8 | 3 | 16 |
| 9 | 1 | 17 |
| 10 | 3 | 20 |
| ∑ | 20 |
It is important to note that the total accumulated absolute frequencies must match the total of the sample. This is a good way to check that it has been calculated correctly.
2. Cumulative relative frequency
The relative frequency is calculated as the quotient of the absolute frequency of a value in the population/sample (fi) between the total values that make up the population/sample (N). To find the accumulated relative frequency we would simply have to accumulate the relative frequencies. This is denoted by the letters Hi.
Suppose that the grades of 20 first-year economics students are as follows:
1,2,8,5,8,3,8,5,6,10,5,7,9,4,10,2,7,6,5,10.
Therefore we have:
Xi = Statistical random variable, first-year economics exam grade.
N = 20
fi = Number of times the event is repeated (in this case, the exam grade).
Hi = Proportion representing the i-th value in the sample.
| Xi | fi | hi | Hi |
| 1 | 1 | 5% | 5% |
| 2 | 2 | 10% | 15% |
| 3 | 1 | 5% | 20% |
| 4 | 1 | 5% | 25% |
| 5 | 4 | 20% | 45% |
| 6 | 2 | 10% | 55% |
| 7 | 2 | 10% | 65% |
| 8 | 3 | 15% | 80% |
| 9 | 1 | 5% | 85% |
| 10 | 3 | 15% | 100% |
Key points
- The data is ordered from smallest to largest before calculating it.
- There are two types: absolute and relative.
- It facilitates the understanding of data distribution.
- It is used in statistical analysis.